The Matching Ronchi Test
A Guide to Usage and Interpretation
John D. UptonOctober 15, 2001
The Matching Ronchi Test for telescope mirrors is very easy to set up and use. Once you understand the basic principals involved, you can use this test to help figure your mirror. Even beginners can quickly learn to visually interpret what the test is telling them about the shape of their mirror. This article is intended to give you the background you need to begin using the Matching Ronchi Test.
Introduction
The Ronchi Test for telescope mirrors is perhaps one of the easiest optical tests to learn and use. Unlike the more common Foucault Test, the beginner will have very little trouble seeing something the very first time they try the Ronchi Test on their mirror. The Ronchi Test can be applied to an optical system at focus or to a mirror on the workbench at the center of curvature. This article covers the latter use.
The Ronchi Test was first described by Vasco Ronchi in 1923. In essence, it is much like the more commonly used Foucault test except that the knife edge is replaced by a grating consisting of fine, opaque, equally spaced lines ruled onto a transparent substrate. The shadows (actually silhouettes) of these fine lines of the grating appear projected onto the face of the mirror under test. The shape and position of these bands is examined and interpreted to give information about the shape of the mirror's surface.
Unlike the Foucault Test, the Ronchi Test is inherently qualitative. It will not allow you to directly assign a wavefront criteria to the errors you see on your mirror. In fact, simply looking at the curvature of the grating's bands projected onto the mirror alone is not sufficient to determine anything about the mirror's shape, much less determining whether the mirror is good or bad. The reason is that for any given band shape, there are many possible mirrors of differing surface profiles and parameters that will appear to match.
This does not mean the Ronchi Test is useless, however. Far from it, this qualitative test is very quick and can provide much useful information about your mirror at a glance. When used in the manner described in this article, the Ronchi Test can be used as a semi-quantitative test. As such, it can allow you to assign an approximate upper bound on the accuracy of your mirror.
The key to effectively using the Ronchi Test is the matching of a complete set of parameters to your mirror. The bands seen on your mirror are compared or matched with a set of patterns from a perfect mirror. The perfect mirror used for matching is virtual in nature. It's theoretical appearance is calculated and displayed on a computer screen or paper printout. Your mirror's appearance must match the virtual mirror when set up in a specific manner. The exact procedure will be described below, but first, let's look at the Ronchi Test in more detail.
Setting Up The Test

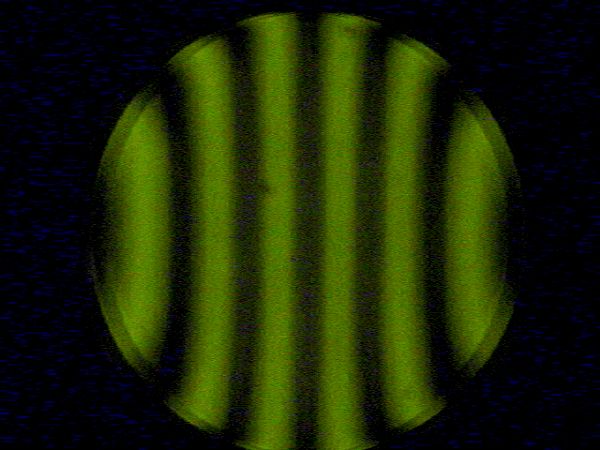
Figure 1 at right shows a schematic representation of the Ronchi Test. A light source is placed near the center of curvature (COC) of the mirror. A grating having from 50 to 250 lines per inch is then also placed near the center of curvature in the returning beam. The light source may consist of either a pinhole or a narrow slit. If a slit is used, maximum contrast and visibility of the bands occurs when the slit and grating lines are oriented precisely parallel to one another. A simplified version of the test setup is to place the Ronchi grating over both the source and the observation point. The grating itself is used to form one or more slits over the light source depending on size. This set up has the advantage of ensuring that the slit(s) are exactly parallel to the grating.
Now, the observer looks through the grating at the mirror. If the tester is near the center of curvature, one or more lines will appear projected onto the face of the mirror. The closer the tester is the COC, the fewer the number of lines that will appear. The shape of the Ronchi bands seen on the mirror vary with the shape of the mirror. They may be either straight or constricted at either the top and bottom or in the center.
See Figure 2 at right for an example. This is an actual Ronchigram image of an 8" F/6.7 mirror. The Ronchigram was captured with an inexpensive Web camera placed at the same position from which the user would view the mirror. Note the two distinct overlapping images. You can see the effect best at the left and right edges of the mirror. The dual images are a diffraction effect caused by the Ronchi grating itself. Depending on the grating and mirror parameters, more overlapping images may be seen. In most cases, these should not cause you many problems. The appearance can be simulated using the Diffract program listed near the bottom of this page. The only thing to keep in mind is that the multiple images will often give the impression of turned edge on the mirror since the edge is shown several times offset laterally from itself. Carefully examine the image at the very edge and mentally "subtract out" the second image in order to properly evaluate the extreme edge of the mirror.
Preparing To Run The Test
In using the Ronchi Test, it is neither useful nor sufficient to simply compare your mirror to a "standard" set of Ronchi patterns. There are no standard Ronchi pattern shapes. The appearance of the Ronchi grating's shadow bands depends strongly on the diameter, focal length, and surface profile of your mirror, the placement of the grating with respect to the mirror's center of curvature, and the number of lines per unit width of the grating. All of these factors are used in calculating the theoretical Ronchi patterns. You should take care to use accurate measurements for your mirror. Matching at a single point to a pattern on your mirror tells you little about the shape of the mirror. You must use accurate Ronchi simulation parameters and carefully perform the complete test as outlined below in order to adequately judge your mirror's figure.
In order to properly run the Matching Ronchi Test, you must first make some preliminary preparations. The first thing to do is to generate a set of Ronchi band patterns specific to your mirror. At the bottom of this article, you will find a list of Ronchi simulation programs you may use. (If you are somewhat ambitious and would like to write your own Ronchi simulator, you may refer to my article on how to perform Ronchi simulation.)
Using the simulator you have chosen, generate a series of images for different grating positions. Each grating position corresponds to a different distance (called an offset) of the grating from the radius of curvature of your mirror. (By convention, the Radius of Curvature of a non-spherical optical component is defined as the radius of curvature of a tiny central area nearest the optical axis. This is also called the paraxial radius of curvature.) You should use at least three grating offsets for your comparisons. Twice that is better. Several of the Ronchi simulation tools listed later can generate a mosaic of six images at different offsets. You should choose two or three offsets inside the radius of curvature (nearer the mirror) and three or four outside the radius of curvature (away from the mirror). I like to choose the innermost offset such that four or five Ronchi bands appear on the mirror. I prefer the outermost offset to show seven or eight Ronchi bands. (I find that too many bands just confuses the comparison.) The remaining offsets are chosen between these limits. Enter you mirror's specifications into the simulation program. Allow the simulator to generate the images at the offsets you have chosen. Finally, print out the images or set up the tester near the computer (or the computer near the tester).
Now, it is time to set up the Ronchi tester. Begin by making sure that the grating is in place and you are using an appropriate light source. A small pinhole probably works best but is not necessarily the easiest nor brightest source. A slit of approximately the same width as one of the gaps (clear areas) in the Ronchi grating will deliver more light than a pinhole. If using a slit for the light source, take care to ensure that it is very nearly parallel to the grating's lines. If the slit is not parallel to the grating, the resulting Ronchi bands on the mirror will be of low contrast and harder to see. It often easiest to just place a relatively large grating over the source allowing it to extend far enough away from the light source that you can also view the mirror through it.
With the tester ready to use, we now set up the tester and mirror. Place the mirror on your test stand. Place the tester on a stable stand at a distance from the mirror approximately equal to twice the focal length. (Twice the focal length of the mirror is the Radius of Curvature.) Adjust the longitudinal position of your tester's moving stage to about one third of the way from its innermost limit of travel. Now use a tape measure and carefully move the whole tester back and forth until the distance between the light source and the mirror's surface is equal to twice your focal length.
The final step is to align the tester and mirror stand so that the image of the light source may be viewed through the grating. Once the tester and mirror are aligned, you should be able to see one or two Ronchi bands on the surface of your mirror. You may want to nudge the tester slightly to one side or another to center a line or gap at the center of the mirror. The only reason here is to better match the simulated images you have generated to make your comparisons.
Performing The Matching Ronchi Test
The first step in running the Matching Ronchi Test is to locate the tester at a known offset with respect to the central zone's center of curvature. I usually use one of the two following methods. They basically work the same and there is no reason I choose one over the other for a session other than just to be different as the mood fits. For both methods, it is best that you have a smooth figure of revolution that looks at least something like a conic pattern with the Foucault Test. Otherwise, a careful measured test may give misleading information.
The two methods of finding a starting point for running the Ronchi test can summarized as follows.
Method 1 Summary
- Set Tester To Paraxial Center Of Curvature Of Mirror
- Adjust the tester's longitudinal stage to match the image seen on your mirror to a simulation of offset 0.00.
Method 2 Summary
- Set Tester To Match Any Specific Offset
- Adjust the tester's longitudinal stage to match any one of the simulated images.
Method 1 Details
Look through the Ronchi grating and adjust your tester so that the pattern on you mirror matches as closely as possible the computer simulated image for the center of curvature (grating offset of 0.000). Match as closely as you can based on the number of bands visible and their placement rather than their curvature. (As you near completion of the mirror, you should match on curvature in addition to the number and zonal crossing position of the bands.) Use this matching point as the assumed radius of curvature and adjust your tester to zero or write down the current reading so you can add it to all other simulated offsets as you run the test.
For Example, if your tester read 0.236" when the 0.000" (radius of curvature) image matched as best as possible, then move the tester to 0.336" for the 0.100" image, to 0.736" for the 0.500" image, etc. For the inside radius of curvature images, you would set the tester to 0.036" (-0.200 + 0.236) for the -0.200" reading, etc.
Method 2 Details
Set up the tester and adjust its position to match one of the simulated zonal images you are using. Again, initially match the number of displayed bands (and their zonal crossing positions as you get close to the target paraboloid) rather than their curvature. Write down the tester reading at the point of best match. Subtract (remembering that inside ROC image offsets are negative) the offset of the simulated image you are matching. Write the result down. You will add this number to all your image offsets to get the required tester position.
For Example, if the innermost image you initially matched was at a simulated offset of -0.300" and your tester reading was 0.189", then first write down 0.189". Now subtract -0.300" and write down (0.189 - -0.300 =) 0.489". This number is then added to each of the offset numbers to tell you where to place the tester. In this example, for the -0.100" image you would move the tester to a reading of 0.389", for the 0.300" image, the tester goes to 0.789" and for the 0.500" image, the tester needs to be moved to 0.989".
Running the test as described above is actually simple and keeping track of the numbers isn't too bad -- you just have to stay focused on procedures. It becomes downright simple if you have a way to reset your tester reading mechanism to a known value after matching the initial image. Then all readings can be made directly from the tester's micrometer or dial. As an alternative, if you have easy access to a computer nearby, you can use a spreadsheet program to do the offset calculations for you. I have such a spreadsheet which you may download. Refer to the links at the bottom of this article.
As you near completion of figuring, it helps to have images of slightly over and under corrected mirrors available so that you can see just how close you are getting. As you look at the mirror, you can compare it to the perfect mirror image as well as mirrors of say 1/8 wave over and under corrected. Using the Matching Ronchi Test in this way will allow you to get quite close to your target.
Interpreting The Ronchi Test
Interpretation of Ronchi Test grating band patterns is governed by a single rule. The general rule of Ronchi testing is this:
"The bands in the Ronchi pattern for any zone become closer together the farther you move from that zone's Center of Curvature. Conversely, the bands in the Ronchi pattern become farther apart the closer you move toward that zone's Center of Curvature."

The reasoning for this rule is very simple. Refer to Figure 3a at the right. Let's assume we have a spherical mirror with the light source at the center of curvature. After striking the mirror and returning, the cone of the converging ray bundle gets smaller as it approaches its focal point at the center of curvature. When we place a grating in this converging cone, the smaller the cone at the point of insertion, the fewer the number of bands on the grating that cut into the light cone. It is the silhouette of these bands that we see on the face of the mirror during the Ronchi Test.
As you move the grating away from the center of curvature in either direction, the cone is larger and the number of bands intersecting the returning beam is increased. Thus it is easy to see why we will always have an increasing number of bands showing on the mirror as we move the grating away from the center of curvature. It is also easy to see that whenever more bands are showing on the face of the mirror, they must appear closer together.
Now, let's extend this concept to a non spherical mirror. As you already know, when tested at the center of curvature, a non-spherical mirror shows spherical aberration -- each annular radial area (or zone) on the mirror's surface focuses its light at a different point along the optical axis. This occurs because the radius of curvature of each radial zone is different. Refer to Figure 3b at the far right.
Here we see the area near the center of curvature of a paraboloidal mirror. The light rays from zones nearer the center of the mirror cross the optical axis closer to the mirror than those from zones nearer the edge. (The edge has a longer radius of curvature than the center.) Let's look at two grating positions in this area of the converging light cone. The gratings are depicted from the top cross sectional view. We see only the ends of the grating's lines depicted as dots. For a grating placed just inside the convergence region of the depicted central zones, we see that few lines will appear near the center of the mirror, yet the grating has cut ten lines of the grating since we are in a relatively large section of the light cone. We would then expect to see ten lines across the mirror with the innermost lines relatively far apart and the outermost lines more crowded together. The bands would bow inward as we look at zones starting in the center of the mirror and then scan up to the top edge of the mirror.
Now, let's examine the second grating position just inside of the convergence region of the depicted outer zones. Here we see that the grating has cut into a smaller portion of the aberrated light cone and will show only four bands. The central rays are diverging here and will show all four bands while the edge zones will show only show a couple of bands. This means that we will see more bands at the center of the mirror and fewer as we scan up from the center to the top edge. The bands are bowing outward at this grating position.
These two examples should show why the curvature of the Ronchi lines occurs. In essence, Ronchi testing consists of examining the mirror one zone at a time from center to top edge applying the Ronchi Testing rule. Look at the number of bands showing on the face of the mirror for each zone from center to top edge. Also look at the points at which the bands cross the horizontal center line of the mirror. Finally, you should pay attention to the rate of curvature of the bands as you scan them from center to top edge. All of these characteristics play a roll in determining the shape of the curve on your mirror.
To summarize, if the Ronchi bands get closer together, in other words they "bend" towards the vertical center line of the mirror as they approach the top edge, then you are farther from the edge's center of curvature than the center's center of curvature. If on the other hand, they get farther apart or "bend" outward as they approach the top edge, then you are closer to the edge's center of curvature than the center's center of curvature.
Let's next apply this principle to see how it works. Refer to Figure 4 at left. What the Ronchi interpretation rule means is that, when using the test, you should look at the very center of the mirror under test and note the separation of two bands that are equidistant from the vertical centerline of the mirror. Now, scan your eye upward towards the 12 o'clock edge position and note whether the grating's bands get closer together or farther apart as they approach the top edge of the mirror.
In our example here, we see that the lines get farther apart as we approach the top of the mirror. Applying our general rule above, this means that the we are closer to the center of curvature of the edge zones of this mirror than we are to its central zones' center of curvature. Note that until we are told where the grating has been placed, we cannot yet say anything about this mirror's actual shape. We can only say with confidence that the grating has been placed closer to the center of curvature of the edge zones than that of the central zones.
If we are now told that the grating has been placed inside the center of curvature of the mirror, we can now begin to guess what shape it has. Since we know the grating is closer to the edge zones and the grating is inside the center of curvature, we infer that the mirror is an oblate ellipsoid of some sort. An oblate ellipsoid is the shape of a mirror whose edge focuses at a shorter distance than its center. (It is an under-corrected sphere.) Also note that we cannot yet say anything about how under-corrected this mirror is. We need to perform the full test in order to deduce that information.
Let's look at some other more specific examples of this phenomenon. In the examples that follow, we will look at a series of simulated Ronchi patterns for grating placements of -0.192", -0.055", 0.082", 0.219", 0.356", and 0.493" from the center of curvature of the central zone. Negative grating offsets indicate placement inside the radius of curvature while positive values indicate placement beyond the radius of curvature. The simulated mirror is a rather ordinary 8" F/7.
Example 1: A perfect sphere (Figure 5 on the left): (All zones have the same radius of curvature.)
At every point you place the grating (whether inside or outside the radius of curvature), it is always equidistant from every zone's center of curvature, so the bands don't bend at all as you visually scan up the mirror from center to the top edge. All the Ronchi bands are straight.
Example 2: A perfect parabola (Figure 6 right): (The edge has a longer radius of curvature than the center.)
Well inside of the radius of curvature, the grating is closer to the center's center of curvature than the edge's. In this case, the bands bend towards the vertical center line of the mirror as they approach the top edge. Well outside the radius of curvature, the grating is closer to the edge's center of curvature than the center's, so the bands bend away from the vertical center line of the mirror.
Example 3: An oblate ellipsoid (gross under-correction)(Figure 7 far left): (The radius of curvature of the edge is shorter than the radius of curvature of the center.)
Well inside of the radius of curvature, the grating is closer to the edge's center of curvature than the center's. In this case, the bands bend away from the center line of the mirror as they approach the upper edge. Well outside the radius of curvature, the grating is closer to the center's center of curvature than the edge's, so the bands bend towards the center line of the mirror as they approach the top edge.
Example 4: A perfect sphere with turned down edge (TDE)(Figure 8 left): (The radius of curvature of the edge is much longer than the radius of curvature of the rest of the mirror.)
Most of the surface has straight bands regardless of where you put the grating. Inside of the radius of curvature, the grating is very far from the edge's center of curvature, so the bands appear straight until they reach the bad zone and then they hook inward sharply. Outside the radius of curvature, the grating will be closer to the edge's center of curvature than the center's, so the bands will be straight over most of the mirror and then hook sharply outward as they reach the edge.
Example 5: A paraboloid with turned down edge (TDE) (Figure 9 far left): (The radius of curvature of the edge is much longer than is normal for a paraboloidal mirror.)
The Ronchi bands are curved much the same as a normal paraboloidal mirror but their curvature increases near the edge zones of the mirror. Compare this mirror to that depicted in Figure 6 above. Inside of the radius of curvature, the grating is very far from the edge's center of curvature, so the bands gently curve inward until they reach the bad zone and then they hook inward sharply. Outside the radius of curvature, the grating will be closer to the edge's center of curvature than the center's, so the bands will gently curve outward over most of the mirror and then hook sharply outward as they reach the bad edge zone. Note that the effects of the bad edge are most apparent outside the radius of curvature.
Example 6: A hyperboloid -- an over-corrected paraboloid (Figure 10 left): (The radius of curvature of the edge is longer than for a paraboloidal mirror.)
The Ronchi bands are curved more than a normal paraboloidal mirror. Their curvature increases rapidly near the edge zones of the mirror. Inside of the radius of curvature, the grating is far from the edge's center of curvature, so the bands curve inward more than for a paraboloidal mirror. Outside the radius of curvature, the grating will be closer to the edge's center of curvature than the center's, so the bands will curve outward to a greater degree than the normal paraboloidal mirror.
Note that the points at which the Ronchi bands cross the horizontal center axis of the mirror are also misplaced. Compare this mirror to that in Figure 6 above. It can be seen that the grating position would have to be moved farther back in order to make the number of bands seen more resemble that of the paraboloidal mirror in the bottom row of images in Figure 6. Even then, their curvature would be seen to differ. This is characteristic of over and under correction on the mirror. In general, when working outside the center of curvature, if you reach the matching number of bands too soon while moving the grating outward, the mirror is under-corrected. If you reach the matching number of bands too late, i.e. too far away, the mirror is over-corrected. Inside the center of curvature, these conditions are reversed. If you reach the approximate matching position too soon while moving the grating inward, your mirror is over-corrected, while reaching an approximate match too late indicates under-correction.
Getting More Information From The Ronchi Test
In addition to helping you figure your mirror, the Ronchi Test is excellent at showing the presence of zones on the mirror. If high or low zones are present on the mirror, the normally smoothly flowing nature of the Ronchi bands is disrupted. There will be irregularities in the shape of the bands when zonal problems are present. You can use the Ronchi interpretation rules as explained above to diagnose any zonal defects on the mirror. For instance, outside the radius of curvature, an area that causes a local outward bowing of the bands is caused by a longer focussing (high) zone.
The Ronchi Test is also a useful tool for examining the surface smoothness of your mirror. The best way to look for indications of a rough surface is to carefully examine the edges of the Ronchi bands. "Dog biscuit," or large scale roughness is very apparent as irregular edges and randomly varying widths on the bands. You will have to "look through" any air turbulence while testing to see the irregularities in the bands's edges, but carefull examination can be quite revealing. While the Foucault test is generally more sensitive to roughness, the Ronchi test can still be used as a very effective initial assessment.
Attempting To Quantify The Ronchi Test
Finally, the Ronchi Test can also be used to give you a very good idea of the degree of correction of your mirror. You can use the test to assign an upper bound to the accuracy of your mirror's figure. All that is required is to compare your mirror to not only a perfect virtual mirror but also to a mirror with a known amount of wavefront error. To do this, you will need to find the conic constant for a mirror similar to yours that deviates from perfect by the amount of wavefront error you specify.
Several of the simulation programs listed below will calculate the appropriate conic constant for you. My program, Ronchi for Windows, will also draw the over and under corrected images for you. For each offset you specify, three images are drawn -- one under-corrected, one perfect, and one over-corrected. This allows direct comparisons to your mirror. Several of the other programs listed will report the conic constant which corresponds to a given wavefront error. You may then use that conic constant in place of your mirror's normal conic to simulate the Ronchi images at each of your offsets. You should generate a set of under-corrected and over-corrected image mosaics for use in your comparisons in addition to the normal set which represent a perfect mirror.
For each offset, compare your mirror to each of the simulated images. Try to note which of the images for a given offset more closely matches your mirror. You can plan your next figuring session based on whether the mirror appears to be mostly under-corrected or over-corrected as a whole. As you get closer to being finished, tighten the wavefront criteria you use to generate the comparison images. Print out this new image set. These resulting new images will be much more similar than before. When you have reached a point that you can no longer easily distinguish between the three images at any offset and your mirror differs little from the images, you may wish to begin using a higher line density (more lines per unit width) grating. The higher line density grating will provide more sensitivity allowing you to more easily discern the subtle differences for the smaller wavefront error allowance. When you have reached a wavefront criteria that you consider "good enough", it is time to perform a final verification test on your mirror and send it off for aluminizing.
Final Testing And Verification
When you are satisfied that your mirror is as good as you wish when tested with the Matching Ronchi Test, you should test it using some other method before declaring it complete. You may use any other test you are familiar with. Since you have a Ronchi Tester already, because of its similarity to a Foucault tester, you can perform that test by replacing the grating with a knife edge. Your newly gained experience with using the Ronchi test may also translate to a shorter learning period with the Foucault test. While using the Foucault test, be sure to examine the mirror's surface for roughness and "dog biscuit". Hopefully, if everything has gone well, your Foucault test results will agree with those you obtained from the Ronchi test. If the results are significantly different, go back and evaluate your procedures for both tests. Resolve the discrepancies and then rerun the tests. If the results do agree, consider this mirror complete.
Instead of using the Foucault test for your final verification, you may wish to use the star test. (It is entirely proper and helpful to use the star test as a final verification even if you have already run the Foucault test with satisfactory results.) The star test is extremely sensitive and powerful. If you are not familiar with star testing, please refer to Harold Suiter's excellent book "Star Testing Astronomical Telescopes" for details. After running the Ronchi test, the Foucault test, and the star test, you should have a very clear picture of the condition of your mirror. If your mirror has passed these tests and shows the classic smooth flowing lines in the Ronchi test, views through the eyepiece should be extremely rewarding. Send the mirror off, congratulate yourself, and prepare for years of enjoyment with the mirror you have just completed.
Additional Resources For Ronchi Testing
In addition to this article, there are other sources of information and tools on the World Wide Web to help you get started using the Matching Ronchi Test. I suggest that you check out the following information links. In addition to the Web Pages, I have also included links to software tools that can simulate the proper Ronchi Test patterns for you to use in your testing. The lists below are by no means exhaustive, they just represent the resources of which I am aware.
Ronchi Testing Web Pages:
- Peter John Smith's Ronchi Testing Pages (Great Detail!) (No longer active online. Archive Link.)
- Mel Bartels Matching Ronchi Test Page
- Mark T. VandeWettering's Ronchi Testing Page (No longer active online. Archive Link.)
- Peter John Smith's Ronchi Patterns For Turned Edge Page (No longer active online. Archive Link.)
- Gert Jan Verhoog's Ronchi Interpretation Page (No longer active online. Archive Link missing figures.)
- Richard Ozer's Ronchi Interpretation Page (No longer online.)
- John Upton's Ronchi Simulation Techniques Page
Ronchi Testing Software Tools:
- Online -- Mel Bartels' Ronchi program (Freeware)
- DOS -- Sky & Telescope's Ronchi BASIC program (Freeware) (No longer online.)
- Windows -- John Upton's Ronchi for Windows program (Freeware)
- Windows -- Peter John Smith's Ronchi with Zones Program (Freeware) (No longer active online. Archive Link.)
- Windows -- Peter John Smith's Ronchi Error Estimation Program (Freeware) (No longer active online. Archive Link.)
- Windows -- Jim Burrows' Diffract program (Freeware) (No longer online.)
- Windows -- Ricardo Dunna's Ronchi program (Freeware) (No longer online.)
- Windows: OpenOffice Spreadsheet -- John Upton's Ronchi Testing Spreadsheet (ODS Format) (Freeware)
- MAC -- Gert Jan Verhoog's MacRonchi program (Freeware) (No longer active online. Archive Link.)
- MAC -- Robert Duval's Ronchi program (Shareware)
- Stellafane's Ronchi Testing Links
Making Ronchi Gratings At Home:
- Clint Bach's instructions for making Ronchi gratings. (No longer active online. Archive Link.)
- Stellafane's printable GIF Image for a Ronchi grating.
Hopefully, this introduction to the Matching Ronchi Test will be sufficient to get you started. While this description may have at times seemed very complex, actually performing the test is quite easy. Try it out. Once you have run through the procedure and seen the Ronchi patterns for yourself, the mystery will be quickly dispelled. Many amateurs have come to use only the Matching Ronchi Test combined with the star test to completely figure their mirrors. This is a very powerful combination. The only possible drawback is that the test will not provide you with a specific "bragging rights" wavefront error you can quote. Don't worry. Rather than quoting an accuracy number to your observing friends, show them how well your mirror performs under the night sky and just quietly smile.